This website aims to support research into Time Series Extrinsic Regression (TSER), a regression task of which the aim is to learn the relationship between a time series and a continuous scalar variable a task closely related to time series classification (TSC), which aims to learn the relationship between a time series and a categorical class label. We recommend you to read the paper for a detailed discussion of the datasets and their sources. If you use the results or code, please cite the paper "Chang Wei Tan, Christoph Bergmeir, Francois Petitjean, Geoffrey I. Webb, Time Series Extrinsic Regression: Predicting numeric values from time series data".
            @article{
              Tan2020TSER,
              title={Time Series Extrinsic Regression},
              author={Tan, Chang Wei and Bergmeir, Christoph and Petitjean, Francois and Webb, Geoffrey I},
              journal={Data Mining and Knowledge Discovery},
              pages={1--29},
              year={2021},
              publisher={Springer},
              doi={https://doi.org/10.1007/s10618-021-00745-9}
            }
If you just use the website, please reference the website as:
Chang Wei Tan, Christoph Bergmeir, Francois Petitjean, Daniel Schmidt, Geoffrey I. Webb, Anthony Bagnall, & Eamonn Keogh (2020). The Monash, UEA & UCR Time Series Extrinsic Regression Archive. URL http://tseregression.org/.| March 2021 | Updated the LiveFuelMoistureContent dataset. |
| March 2021 | The paper "Time Series Extrinsic Regression" is now published in Data Mining and Knowledge Discovery. |
| December 2020 | The paper "Time Series Extrinsic Regression" is now in Press. |
The following table shows a list of time series extrinsic regression datasets. You can download the entire spreadsheet displayed below here and the whole dataset here (about 600 MB). The datasets are available in sktime .ts format. An example of loading the data can be found in our github repository.
The results page shows some baseline on these data using typical regressors.
| ID | Type | Dataset | Train Size | Test Size | Length | Dimension | Missing Values | Donor/Source |
|---|---|---|---|---|---|---|---|---|
| 1 | Energy Monitoring | AppliancesEnergy | 96 | 42 | 144 | 24 | No | Luis Candanedo (UCI Repository) |
| 2 | Energy Monitoring | HouseholdPowerConsumption1 | 746 | 694 | 1440 | 5 | Yes | Georges Hebrail & Alice Berard (UCI Repository) |
| 3 | Energy Monitoring | HouseholdPowerConsumption2 | 746 | 694 | 1440 | 5 | Yes | Georges Hebrail & Alice Berard (UCI Repository) |
| 4 | Environment Monitoring | BenzeneConcentration | 3433 | 5445 | 240 | 8 | Yes | Saverio De Vito (UCI Repository) |
| 5 | Environment Monitoring | BeijingPM25Quality | 12432 | 5100 | 24 | 9 | Yes | Song Xi Chen (UCI Repository) |
| 6 | Environment Monitoring | BeijingPM10Quality | 12432 | 5100 | 24 | 9 | Yes | Song Xi Chen (UCI Repository) |
| 7 | Environment Monitoring | LiveFuelMoistureContent | 3493 | 1510 | 365 | 7 | No | LiuJun Zhu |
| 8 | Environment Monitoring | FloodModeling1 | 471 | 202 | 266 | 1 | No | Jihane Elyahyioui |
| 9 | Environment Monitoring | FloodModeling2 | 389 | 167 | 266 | 1 | No | Jihane Elyahyioui |
| 10 | Environment Monitoring | FloodModeling3 | 429 | 184 | 266 | 1 | No | Jihane Elyahyioui |
| 11 | Environment Monitoring | AustraliaRainfall | 112186 | 48081 | 24 | 3 | No | Bureau of Meteorology Australia |
| 12 | Health Monitoring | PPGDalia | 43215 | 21482 | 256-512* | 4 | No | Attila Reiss, Ina Indlekofer & Philip Schmidt (UCI Repository) |
| 13 | Health Monitoring | IEEEPPG | 1768 | 1328 | 1000 | 5 | No | Zhilin Zhang (IEEE Signal Processing Cup 2015) |
| 14 | Health Monitoring | BIDMCRR | 5471 | 2399 | 4000 | 2 | No | Peter Charlton & Marco Pimentel (PhysioNet) |
| 15 | Health Monitoring | BIDMCHR | 5550 | 2399 | 4000 | 2 | No | Peter Charlton & Marco Pimentel (PhysioNet) |
| 16 | Health Monitoring | BIDMCSpO2 | 5550 | 2399 | 4000 | 2 | No | Peter Charlton & Marco Pimentel (PhysioNet) |
| 17 | Sentiment Analysis | NewsHeadlineSentiment | 58213 | 24951 | 144 | 3 | No | Nuno Moniz & LuÃs Torgo (UCI Repository) |
| 18 | Sentiment Analysis | NewsTitleSentiment | 58213 | 24951 | 144 | 3 | No | Nuno Moniz & LuÃs Torgo (UCI Repository) |
| 19 | Forecasting | Covid3Month | 140 | 61 | 84 | 1 | No | covid19.who.int |
* These datasets have equal length series but differs between dimensions.
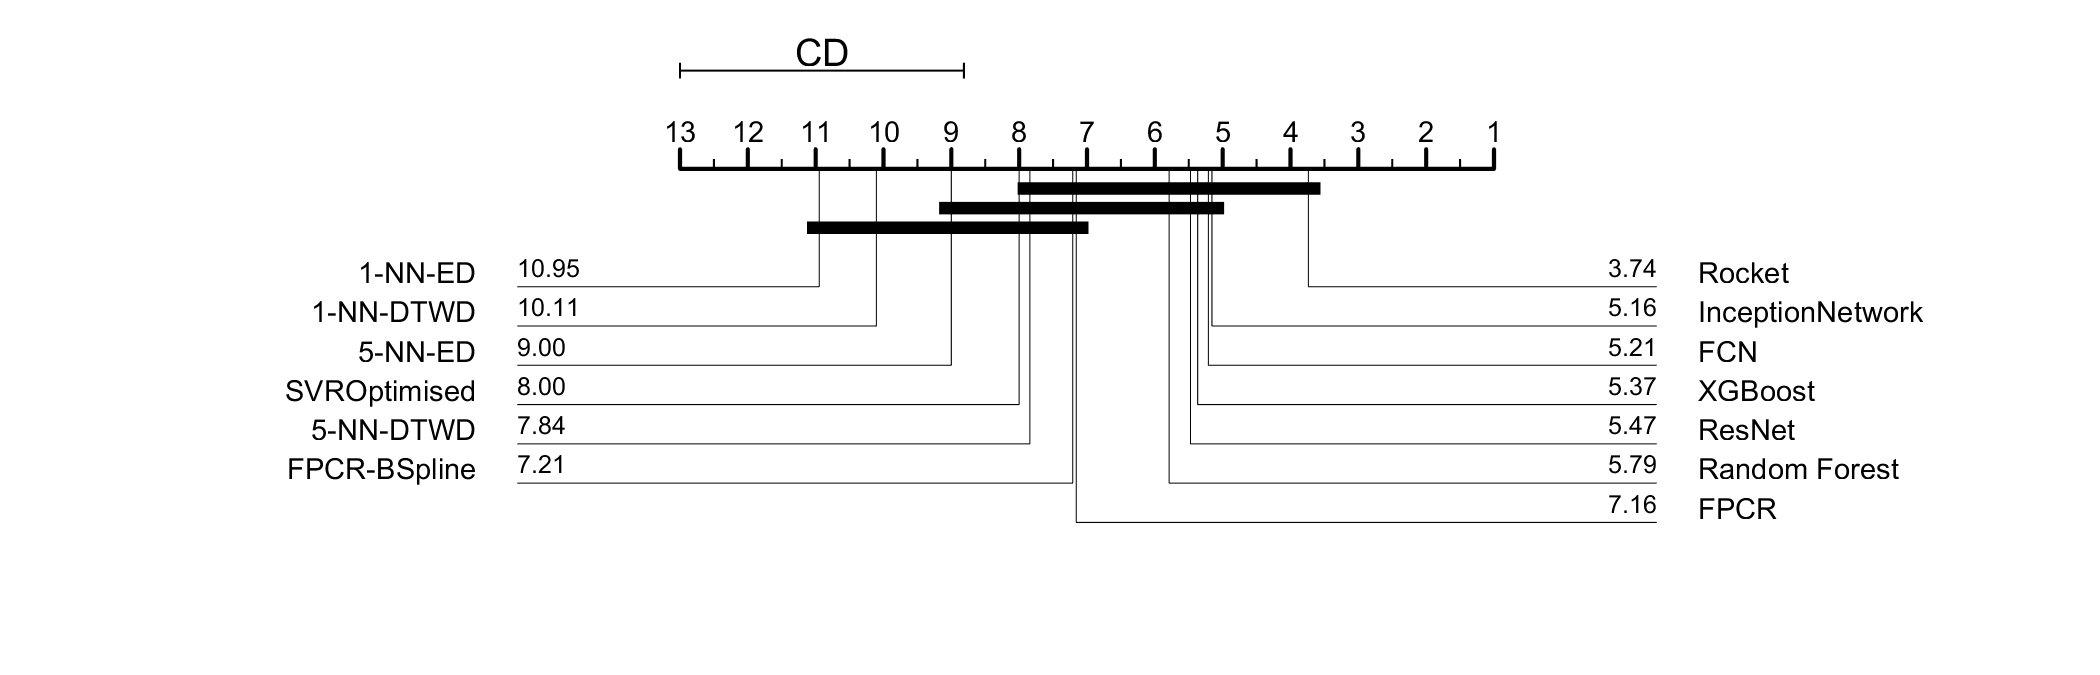
The following is the raw result for each of the dataset and regressor. The same results can be obtained from here
| Dataset Name | FPCR | FPCR-Bspline | SVR Optimised | RandomForest | XGBoost | 1-NN-ED | 5-NN-ED | 1-NN-DTWD | 5-NN-DTWD | Rocket | FCN | ResNet | InceptionNetwork |
|---|---|---|---|---|---|---|---|---|---|---|---|---|---|
| AppliancesEnergy | 5.405052 | 5.405052 | 3.454574 | 3.4551198 | 3.489024 | 5.231953 | 4.227438 | 6.036547 | 4.019873 | 2.2990312 | 2.865684 | 3.065047 | 4.43533 |
| AustraliaRainfall | 8.436335 | 8.436336 | 8.650856 | 8.389541 | 8.492986 | 30.254139 | 10.232841 | 12.001981 | 11.95073 | 8.124137333 | 8.425874 | 8.179173 | 8.841251 |
| BeijingPM10Quality | 99.725946 | 99.732125 | 110.574226 | 94.072344 | 93.138127 | 139.22979 | 115.669411 | 139.134908 | 115.502744 | 120.0577646 | 94.348729 | 95.489374 | 96.749997 |
| BeijingPM25Quality | 69.379217 | 69.369892 | 71.437076 | 63.301428 | 59.495865 | 88.193545 | 74.156382 | 88.256082 | 72.717689 | 62.769655 | 59.726847 | 64.462746 | 62.227924 |
| BenzeneConcentration | 11.088396 | 11.094974 | 4.790901 | 0.855559 | 0.6377256 | 6.535685 | 5.84498 | 4.983578 | 4.868465 | 3.360614 | 4.988295 | 4.0612608 | 1.584852 |
| BIDMC32HR | 13.980558 | 13.980597 | 13.39297 | 15.016468 | 13.963799 | 14.836506 | 14.756088 | 15.29101 | 15.127008 | 13.9443828 | 13.130665 | 10.74142 | 9.424679 |
| BIDMC32RR | 3.364777 | 3.364704 | 3.17366 | 4.350314 | 4.367828 | 4.387345 | 4.134685 | 3.529111 | 3.432247 | 4.0929006 | 3.577775 | 3.921214 | 3.018405 |
| BIDMC32SpO2 | 4.953519 | 4.953517 | 4.796855 | 4.570262 | 4.450805 | 5.530202 | 5.407875 | 5.215027 | 5.123964 | 5.221737 | 5.968337 | 5.987832 | 5.57612 |
| Covid3Month | 0.044912 | 0.044912 | 0.06584 | 0.0424 | 0.044682 | 0.05306 | 0.041815 | 0.052735 | 0.042943 | 0.0438782 | 0.07434 | 0.095338 | 0.053769 |
| FloodModeling1 | 0.018853 | 0.018853 | 0.046304 | 0.015891 | 0.0159712 | 0.01482 | 0.016193 | 0.011689 | 0.009801 | 0.002356 | 0.006709 | 0.008868 | 0.01743 |
| FloodModeling2 | 0.019079 | 0.019079 | 0.075804 | 0.014095 | 0.018199 | 0.018552 | 0.018586 | 0.016356 | 0.016238 | 0.005881 | 0.006719 | 0.013939 | 0.00729 |
| FloodModeling3 | 0.021458 | 0.021458 | 0.035032 | 0.020429 | 0.0207038 | 0.019947 | 0.020765 | 0.01375 | 0.013337 | 0.004064 | 0.007873 | 0.01558 | 0.00821 |
| HouseholdPowerConsumption1 | 147.548998 | 147.5492 | 152.391358 | 248.858964 | 231.089829 | 473.932736 | 432.594707 | 427.04311 | 297.221675 | 132.798779 | 162.244492 | 193.207281 | 153.716402 |
| HouseholdPowerConsumption2 | 46.925185 | 46.929783 | 55.98083 | 46.932139 | 44.3729326 | 71.479369 | 64.272956 | 58.802634 | 51.494969 | 32.607104 | 46.829256 | 39.080121 | 39.409826 |
| IEEEPPG | 31.381214 | 31.381212 | 37.254146 | 32.10907 | 31.487901 | 33.208862 | 27.111213 | 37.140393 | 33.572786 | 36.5154892 | 34.325728 | 33.150985 | 23.903929 |
| LFMC | 37.683857 | 37.688074 | 39.733527 | 32.1626252 | 32.441886 | 47.836798 | 38.535526 | 39.971707 | 35.185301 | 29.4097538 | 33.25722 | 30.3516564 | 28.796294 |
| NewsHeadlineSentiment | 0.142273 | 0.142272 | 0.142917 | 0.147582 | 0.142486 | 0.202821 | 0.156636 | 0.197937 | 0.155839 | 0.142244 | 0.148065 | 0.150024 | 0.150014 |
| NewsTitleSentiment | 0.138126 | 0.138126 | 0.138881 | 0.143103 | 0.138336 | 0.193318 | 0.15095 | 0.187257 | 0.150564 | 0.138059 | 0.138082 | 0.138295 | 0.158558 |
| PPGDalia | 20.674488 | 20.674486 | 19.005216 | 17.530628 | 16.58273 | 21.876567 | 18.282277 | 26.024576 | 20.768389 | 14.050544 | 13.038805 | 11.382165 | 9.923701 |
We are a group of time series researchers from Monash University, University of East Anglia and University of California Riverside:
 |
 |
 |
 |
 |
 |
 |